Thursday, August 5, 2021

Application Insights - Transaction trend over time and analyze further

This article is related to the previous one I wrote about Application Insights - Investigate performance

From the previous article, I explained how to investigate performance of a specific operation and monitor end-to-end transaction. I will continue where I stopped and I will use the same operation to illustrate.

In order to access the trend of specific request over the time, need to click on following link


It will load events chart as below. In order to properly identify a pattern I will select last 48 hours history. You can observe that there is a peak starting from 1.30PM and gradually reducing everyday


We can further analyze the same chart by splitting each bar with other parameters. As an example I use Performance parameter to split bars.


I'll Zoom into a specific area. You can see there are some calls which took around 1-3 seconds (Shown in green color) 


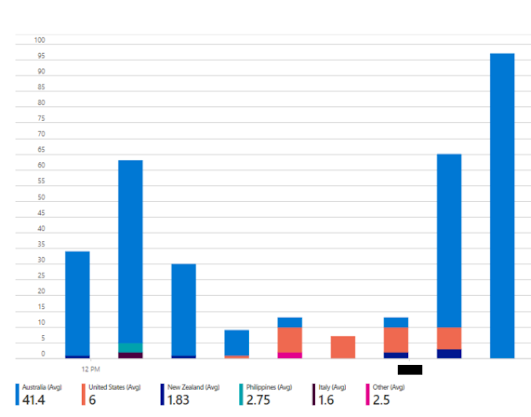
I will split bars with another parameter. This time I'll use Country or Region

Tuesday, August 3, 2021

Azure Application Insights - Investigate Performance

Azure Application Insights provide great features to dig deep into application calls. We can identify performance issues and areas for improvements by working with given insights. 

I investigated performance of a live application using this feature, and I'll guide you through the process using this article.

Following are the steps I used to analyze an operation

1. Navigate to Application Insights instance and click on Application Map. Select a call that you need to analyze further


2. Click on Investigate Performance button. It'll show API calls in a time series. From the below image we can see that highest time consuming operation is /connect/token.


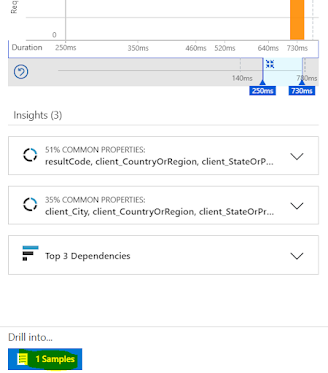
By clicking on connect/token operation, we can further analyze it. Distribution of duration graph will scope to selected operation and you can see it in the top right side. Since there are some calls which took more than 500ms, we can select that time range to further study.


3. Click on the samples button to see actual calls and dependencies


4. It'll load samples and we can select specific sample to analyze


By looking at the call stack, we can see there are around 30 separate calls to a specific SQL Server instance from this single operation.

There may be an opportunity to optimize further. May be we can reduce some calls if they are duplicate by a developer mistake. Or we might combine few calls together and send via a single operation.

Sunday, August 1, 2021

Azure Application Insights - Debug API failures to database level using Application Map

Application Insights is a rich Application Performance Management (APM) feature provided in Microsoft Azure to monitor live applications. It allows you to evaluate real time analytics of your applications

Following are the key options provided.


Application Map

Application map allows you to check interactions among your application components and to drill down to any failures or performance concerns. In this post I'll summarize how to see API failures and drill down to a specific issue.

I have a live application which is hosted in Azure and I've configured it for Application Insights. Following is the component interaction map of my application.


Some arrows are colored in red, where those are the items we need to focus on.

I thought of drilling further into one specific interaction. You can do it by clicking on a information title embedded in an arrow (in this instance I clicked on the point with 702ms | 0.1%)

  • Average response time is 702ms
  • Failure percentage is 0.1%


This will open up a summary with failures, which I'm concerned about. I can see there are 2, 547 error instances. Lets dive deeper. In order to further debug, let's click on Investigate failures button.


In this view I can see when those erroneous transactions occur in a timeline and in the next tab I can see overall failures where I can further drilldown by clicking on the error instances. Here, I have to click on the number 2. It'll open up another blade where it shows the error description


Now click on the blue arrow to see further details

Now click on [show more] to see the detailed error message
By using the Application Map feature, we can drill down to the database level to debug issues


Thursday, July 22, 2021

Azure Identity Protection to protect your credentials

With Azure Identity Protection (Azure AD P2 feature), Azure provides necessary precautions to protect and safeguard identities. 

Some of the common risks with identities are

  • Leaked credentials
  • Malware linked IP addresses
  • Unfamiliar sign-in properties
  • and many more,
As you can assume, it is very difficult to manually monitor each and every corner of the internet to check our credentials are compromised.

As a remedy Microsoft provides us with Identity Protection feature which has an automated detection of identity based risks. 

Identity Protection will provide remediation using different policies. We have two main policies to support us.


User risk policy
Azure will identity user accounts that may have compromised credentials. Policies will define what actions to be performed for such accounts

Based on the severity of the user risk, Azure will classify the riskiness as low, medium and high.

Following is the approach to configure User risk policy

Step 1 : Select target users


Step 2 : Select the risk level


Microsoft recommends to put the threshold to High.


Step 3 : Select the control


According to this setting in above diagram, user access will be blocked.


Sign-in risk policy
Azure will identify suspicious sign-in attempts of users. Policies will define what actions to be performed for such accounts

Based on the severity of the user risk, Azure will classify the riskiness as low, medium and high.

Following is the approach to configure Sign-in risk policy

Step 1: Select target users


Step 2 : Select the risk level


Microsoft recommends to put the threshold to Medium and Above.


Step 3 : Select the control


According to this setting in above diagram, user access will be blocked

After policies are set, administrators can refer various reports to obtain further insights.


Wednesday, July 21, 2021

Resolving the error: The directory currently selected differs from this key vault's directory

Recently after a migration, I could see a warning message in one of my Azure Key Vaults. It says,

The directory <Logged in directory> currently selected differs from this key vault's directory. Some actions will be disabled. Click for more details


If you can see, the directory name is empty. And the directory id is also different. We need to map the Key Vault to the correct tenant. How can we do it?

It is very easy. Use Azure Cloud Shell and execute following statements.

az account set --subscription "Visual Studio Enterprise Subscription"
$tenantId=$(az account show --query tenantId)                               
az keyvault update -n  --remove Properties.accessPolicies 
az keyvault update -n  --set Properties.tenantId=$tenantId

This resolved the issue.

Wednesday, June 16, 2021

Protect your Azure hosted applications with Front Door, WAF and OWASP

You can have your applications hosted in Azure. How can you ensure that they are protected from various attacks?

We are safe if we can use an intelligent Firewall in front of our applications and ensure common attacks are addressed with the guidance of well recognized body, Isn't it.

We can use Azure Front Door and Open Web Application Security Project (OWASP) rules to achieve the above.

Let me explain how to do it.

We can implement a custom WAF policy and apply it to frontends in Azure Front Door.

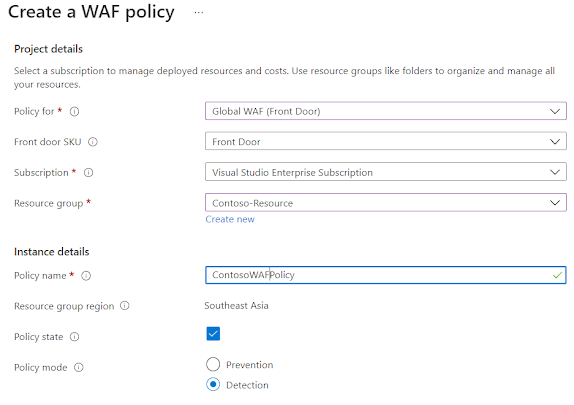
Step 1: Create a WAF policy


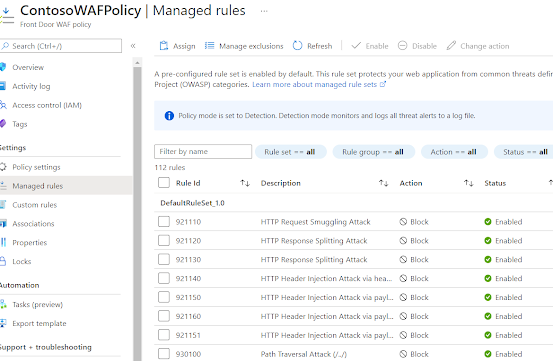
Step 2: Navigate to Manage rules section. OWASP rules are enabled by default. You can disable certain rules if you don't need them


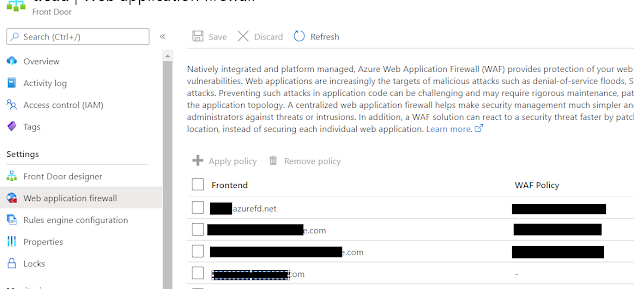
Step 3: You can apply the policy to Frontends in Azure Front Door easily by navigating to Azure Front Door instance


That's it. For any attacks the firewall will provide 403 response now.

Azure Bastian - Safer way to access your Virtual Machines

Remember the way we used to login to VMs hosted in our cloud platforms. 

We open RDP ports (3389) from the interface and indefinitely allow users to RDP. 


We might limit the source of the IP, but we have directly opened connectivity to our VMs over the internet.

What are the risks associated with the traditional approach?

  • Malicious parties can get access to VMs as RDP ports and protocol is well known
  • There is no audit of the activity users are performing
  • VM is directly opened to the internet
So, what were the work arounds we have being using so far?
  • Change the RDP port to a custom port
  • RDP jump box (Users RDP to jump box server and again RDP to desired VM)
Is there any permanent solution? Azure Bastion is the way to go

What is Azure Bastion?

Azure Bastion is a managed service provided by Microsoft Azure. We can add Bastion to our Virtual Network. Then it will work as a Network Virtual Appliance (NVA). 

This solution allows users to RDP or SSH to virtual machines without exposing those VMs to the internet. So they will not require public IPs.

Azure Bastian will provide RDP or SSH sessions within the Azure Portal itself over HTTPS.

How it works?

When you create a Azure Bastian service, it will create a Virtual Machine Scale Set (VMSS) in a predefined subnet (AzureBastianSubnet). Since we have a VMSS, it can scale itself based on the RDP requests it needs to cater.

When a user selects to connect to a VM using Azure Bastian
  • It will receive the request over HTTPS
  • Bastian will create RDP/SSH session internally to the desired VM (uses Private IP of the VM)
  • Response is sent over HTTPS to the user