Azure Application Insights provide great features to dig deep into application calls. We can identify performance issues and areas for improvements by working with given insights.
I investigated performance of a live application using this feature, and I'll guide you through the process using this article.
Following are the steps I used to analyze an operation
1. Navigate to Application Insights instance and click on Application Map. Select a call that you need to analyze further

2. Click on Investigate Performance button. It'll show API calls in a time series. From the below image we can see that highest time consuming operation is /connect/token.

By clicking on connect/token operation, we can further analyze it. Distribution of duration graph will scope to selected operation and you can see it in the top right side. Since there are some calls which took more than 500ms, we can select that time range to further study.

3. Click on the samples button to see actual calls and dependencies
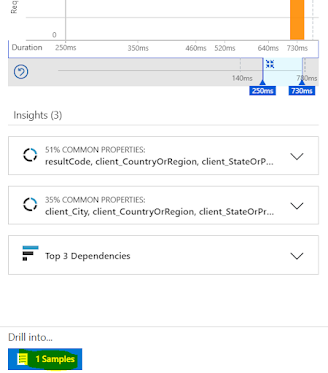
4. It'll load samples and we can select specific sample to analyze

By looking at the call stack, we can see there are around 30 separate calls to a specific SQL Server instance from this single operation.
There may be an opportunity to optimize further. May be we can reduce some calls if they are duplicate by a developer mistake. Or we might combine few calls together and send via a single operation.
No comments:
Post a Comment