This article is related to the previous one I wrote about Application Insights - Investigate performance
From the previous article, I explained how to investigate performance of a specific operation and monitor end-to-end transaction. I will continue where I stopped and I will use the same operation to illustrate.
In order to access the trend of specific request over the time, need to click on following link
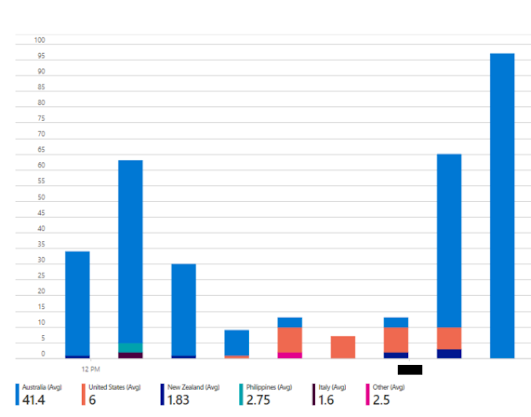
It will load events chart as below. In order to properly identify a pattern I will select last 48 hours history. You can observe that there is a peak starting from 1.30PM and gradually reducing everyday
We can further analyze the same chart by splitting each bar with other parameters. As an example I use Performance parameter to split bars.
I'll Zoom into a specific area. You can see there are some calls which took around 1-3 seconds (Shown in green color)


No comments:
Post a Comment