Thursday, December 21, 2023

Simulating Azure event hubs functionality end to end with Azure Data Explorer and generate data feature

To evaluate Azure Event Hubs functionality, typically we need to develop an application for data ingestion and another for data consumption

In my previous blog post, I outlined the process of discovering ingested data in Event Hubs using Azure Data Explorer. In this article, I will demonstrate how to ingest data into Event Hubs without writing a single line of code.

Our first step is to navigate to the Event Hubs instance and access the Generate data (preview) feature.


Multiple options are provided to ingest payload either from pre-canned datasets or custom payloads based on a given schema.


Once you click on the send button, the data will be ingested to our even hub instance.

Then, you can easily discover this data in your pre-configured Azure Data Explorer. I have detailed the steps involved in configuring Azure Data Explorer in my previous blog post.


This approach allows you to explore the functionality of Event Hubs without writing any code!

Tuesday, December 12, 2023

Visualizing ingested events in Azure Event Hub with Azure Data Explorer

In modern cloud-based solutions, event-driven architectures are very common. Microsoft Azure facilitates event processing through Azure Event Hubs, offering essential building blocks to implement scalable solutions capable of processing large volumes of events and data with low latency and high reliability.

Debugging or testing event-based solutions can be challenging due to the nature of their architecture. It requires implementing ingesting applications and consumers to verify the functionality of event-based solutions.

In this article, I will demonstrate how to leverage Azure Data Explorer to visualize ingested data without any delay. With this solution, there is no need to create any custom solutions to view the contents of our Event Hub instance.

First, we need to create our Azure Data Explorer cluster.


Next, we will create a database in Data Explorer.


To connect Data Explorer with Event Hubs, let's enable a managed account at the Data Explorer instance.


After enabling the managed account at the Data Explorer instance, we need to assign the required permissions to the Event Hub.


Now, let's configure Data Explorer for our Event Hub. Navigate to the Event Hub and select the "Analyze data" option.


Let's link our Data Explorer instance


Now that our configuration is complete, let's ingest some data and explore it in Data Explorer.

To explore our data, navigate to Data Explorer and go to the Query section. Then, select the table and run your query to explore the ingested data.


Sunday, December 3, 2023

Ensure Azure resource compliance for critical workloads with Azure Security Center Policies

Security and compliance are paramount in a zero-trust cloud environment. Azure policy is one key control Azure employs to achieve zero-trust.

Azure Security Center monitors your resources against a set of policy initiatives, defined according to the Microsoft Cloud Security Benchmark.

By default, those policy initiatives are named ASC Default.


When navigating through a specific Azure Policy initiative, you can review the current compliance status.


We need to prioritize certain critical workloads, such as safeguarding sensitive information stored in an Azure SQL instance.

To check the compliance of a specific resource, such as our Azure SQL instance, there are various methods available. However, in this article, I'll focus on how to do it directly within Azure Policy.

Within the initiative compliance screen, you can easily navigate to non-compliant resources by clicking on the "Non-compliant resources" tab.


In this section you can see all the resources those are not compliant against the Microsoft cloud security center benchmark.

You can specify the name of your resource or use filters to narrow your search.


Once you locate your resource, you can proceed to the resource compliance page to view which policies it is not compliant with.


This serves as an excellent starting point to secure your resources and enhance your cloud security posture.

Sunday, November 26, 2023

Azure Monitor: How to View Alerts Triggered on a Resource in a Timeline View

Azure alerts enable you to receive notifications or take automated actions based on predefined conditions occurring within your Azure resources.

In this article, I will demonstrate a straightforward method for monitoring alerts triggered by specific alert rule(s) within a designated timeframe for a resource. This approach enables us to promptly identify any issues and correlate them with other incidents that occurred during the same period. 

Additionally, it facilitates cross-referencing with metrics such as CPU usage, memory consumption, and more, within the same time interval.

Let's pick a resource. I'll choose Azure Front Door where my alerts are configured.

Navigate to Alerts blade in Monitoring section.


Choose the "View as timeline" option, as illustrated in the diagram below.


Upon selecting that option, alerts will be displayed in a chronological timeline.


You can click on a bubble to access more detailed information.


Upon clicking on a specific incident, you will be provided with comprehensive details.


Monday, November 20, 2023

Detecting malicious requests from bots with Azure monitor and securing workloads using WAF

There are bots and botnets on the internet constantly attempting to exploit vulnerabilities in applications for their advantage. Since Azure public IP ranges are readily available, the risk of such attacks is ever-present. IP ranges are available for various reasons and it is our responsibility to safeguard our assets.

In this article I will demonstrate how to identify such attempts to gain unauthorized access to our precious applications using Azure Monitor - Application Insights. Additionally, I'll illustrate how to safeguard our resources with Azure Front Door - Web Application Firewall (WAF).

Let's explore the process of detecting malicious attempts from bots.

Navigate to Application Insights and go to the Failures tab. You will notice a substantial number of errors in the 400 category, particularly 404 errors as per the image below.


Let's identify the origin of those requests. There are several methods to achieve this. But I prefer the following approach. Navigate to Usage > Events > View More Insights.


Based on the origins of the requests, I can confirm that they are not acceptable.

Now that we have identified a risk, the next step is to safeguard our applications. If you have configured Azure WAF, the process is straightforward.

Let's navigate to  Web Application Firewall (WAF).

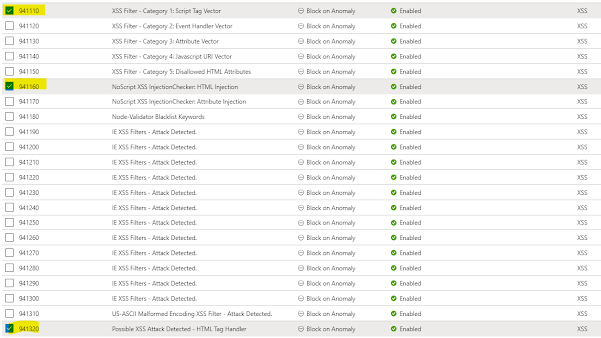
I have enabled only the Microsoft_DefaultRuleSet_2.1 as the set of rules in our WAF to filter requests. Unfortunately, it doesn't include any rules to filter requests from bots.

Fortunately, we can address this by adding an additional ruleset to my default rules. To add an additional ruleset, click on Managed Rules, and then click on the Assign button. In the Additional rule set option, select Microsoft_BotManagedRuleSet_1.0, as shown below.


Once it is applied, it will add another set of rules to handle bots


That concludes the necessary steps. Our application is now in good hands.

Sunday, November 12, 2023

Analyzing Worst-Case latency experience with Azure Monitor - Application Insights

This article discusses how we can identify and analyze the worst case response of an application/API with Azure Monitor - Application Insights.

We can start the analysis with the Performance blade of the Application Insights workspace.

By default it provides a glimpse of average response.


However, our focus lies in identifying the worst-performing results. Let's transition to the 99th percentile.


We've identified a culprit. There's a conspicuous outlier. Now, let's delve deeper. Our goal is to pinpoint the root cause. Is it within our codebase, or is it linked to a dependency?

There are several avenues to explore this, but I find the Transaction Search feature to be the most effective. Let's navigate to that.

For now, we won't filter by API name, but it's advisable to choose the 99th percentile.


We can observe the peak request there. Let's refine our view by selecting only "Request & Dependency" as filters.


We've already got the answer. It appears to be due to a dependency, as indicated by the yellow line on the graph.

We can even delve deeper to the leaf level to identify the specific request and dependency. Let's narrow down the time period and revisit the results.


Here are the results I obtained in the results section.


This discovery is the starting point for my optimization. We can proceed to take the necessary actions regarding the dependencies.

Sunday, November 5, 2023

How to use Azure Monitor - Application Insights to identify performance bottlenecks with dependent resources

When implementing services, we frequently rely on other services or resources. To ensure the efficiency of our solution, it's crucial to pinpoint performance bottlenecks within our system. These bottlenecks can originate from our own codebase or may stem from dependent services, such as external APIs.

You are in safe hands if you have configured Azure Monitor - Application Insights with your solution.

One valuable starting point is to explore Application Insights - Application Map. In the diagram below, you'll notice that calls to External API 2 are slower, as highlighted by the red arrow.


We can further drill down by clicking on the red arrow (the link from our API to External API 2) to identify exactly what API endpoints are slower.


When you click on it, another blade will open, revealing a sample of the slowest calls and offering the option to delve deeper into performance issues. Let's click on the 'Investigate Performance' button.

This action will unveil an informative dashboard that provides a snapshot of performance with regards to the execution of External API 2.


As you can observe, there are certain slow API calls. If you wish to examine samples, simply click on a slow API call and select the 'Samples' button. Then, choose a specific sample to access more detailed information.


In most cases, this information should be adequate to identify performance issues and make improvements.

Monday, October 30, 2023

Azure App Service plan automatic scale out method

In the premium tier of the Azure App Service plan, there is a new scaling method known as "Automatic". This is currently in Preview.


With this approach, you no longer need to define specific scaling rules, as is the case with rule-based scaling. Instead, you only need to specify the maximum number of instances, and Azure will automatically manage the scaling process.

Once you've configured this method, you can navigate to the App Service plan metrics, such as CPU percentage, and observe how new instances are seamlessly added and subsequently removed from the plan.


On the above graph, the activity on each instance is displayed in distinct colors.

Wednesday, October 18, 2023

A Deep Dive into Microsoft Teams Adoption - Technical session for Arq Group

I had the privilege of leading two technical sessions for Arq Group, a division of NCS Australia, aimed at facilitating the transition to Microsoft Teams and Azure. Previously reliant on Slack, the organization now seeks to embrace the Microsoft ecosystem, and I was honored to guide them through this migration process.

The sessions saw a remarkable turnout, with over 400 enthusiastic participants actively engaging in the discussions and activities.


Wednesday, October 11, 2023

Enhance API Security: Safeguard against Cross-Site Scripting (XSS) attacks with Azure Web Application Firewall

In this article, I'll illustrate how Azure Front Door Web Application Firewall (WAF) shields against Cross Side Scripting (XSS) attacks, ensuring robust protection for your applications.

I'm leveraging Azure Front Door Premium, which includes a WAF policy with managed rulesets, providing enhanced security measures for my applications.

We will start the process by assigning the Microsoft Default ruleset to the WAF policy.


That's all we need to do. The WAF will handle the rest.

Let's attempt to simulate a Cross Site Scripting (XSS) attack.


Azure Front Door WAF has effectively countered the attack. Let's examine the WAF logs to review the outcomes. I'm utilizing a simple KQL query as below.

AzureDiagnostics
| where ResourceProvider == "MICROSOFT.CDN" and Category == "FrontDoorWebApplicationFirewallLog" 
and action_s == "AnomalyScoring"
| project requestUri_s, ruleName_s, details_data_s,details_matches_s, action_s


Here are some of the rules that intercepted our malicious request.


Thursday, September 14, 2023

Resolve Azure Data Explorer error - Principal 'aaduser=xxx' is not authorized to perform operation 'VersionShowCommand'

When provisioning a new Azure Data Explorer cluster and navigating to the query section, you may receive an error message stating that the principal 'aaduser=xxx' is not authorized to perform the operation 'VersionShowCommand'.


To resolve the issue, you must grant the necessary permissions to the user principal referenced in the error message.

Begin by navigating to the Security + Networking section and selecting the Permissions menu.


Then, choose either AllDatabasesAdmin or AllDatabasesViewer based on your specific requirements.


Next, assign the user principal mentioned in the error message to grant the desired permission.


That's all you need to do. Now you can access the cluster


Tuesday, September 5, 2023

Designing an active/passive solution using Azure Front Door with priority based traffic routing

Suppose we aim to implement a solution in Azure while ensuring disaster recovery is effectively managed. In such cases, it's often necessary to deploy one instance of the solution as primary and another instance as the standby.

Remember, our objective is not to balance the load but to establish a disaster recovery solution.

The following diagram illustrates how to implement both load balancing and disaster recovery.


We can utilize Azure Front Door to implement the active/standby topology that we are interested in. Azure Front Door enables traffic routing based on latency, priority, round robin, and weighted round robin.

By employing priority-based traffic routing, we can establish an active/standby topology, which is ideal for disaster recovery implementation. According to the provided design, we should assign the same priority (e.g., 1) in the load balancing solution and a different priority (e.g., 2) for the disaster recovery solution.


To achieve this, you need to update the route you are interested in. You can apply a priority by changing the origin (represents an application server) of an origin group (represents application server collection/farm).


That's all you need to do. The secondary origin will receive the traffic when the primary origin is offline.