Let's assume we have a complex solution with multiple external integrations. Identifying issues can be challenging, as error messages are often intricate and difficult to interpret.
Consider the following example, where multiple integrations are in place.

How can I check only my code to focus on what I can control? It’s simple—just select the "Just My Code" checkbox.

Once I do that, I can identify the specific points in my code that triggered the error.
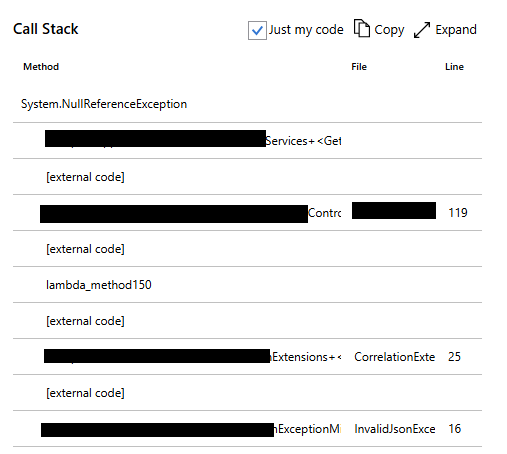
Now, I understand the root cause of the problem and can explore possible solutions.
No comments:
Post a Comment